The economy in general and the real estate market in particular develop cyclically. To determine the cycles, they analyze information about the periodic fluctuations of the main indicators of business activity. These fluctuations occur as a result of an imbalance between supply and demand. As a rule, demand changes very quickly, and supply lags behind it, which is why cyclicality arises.
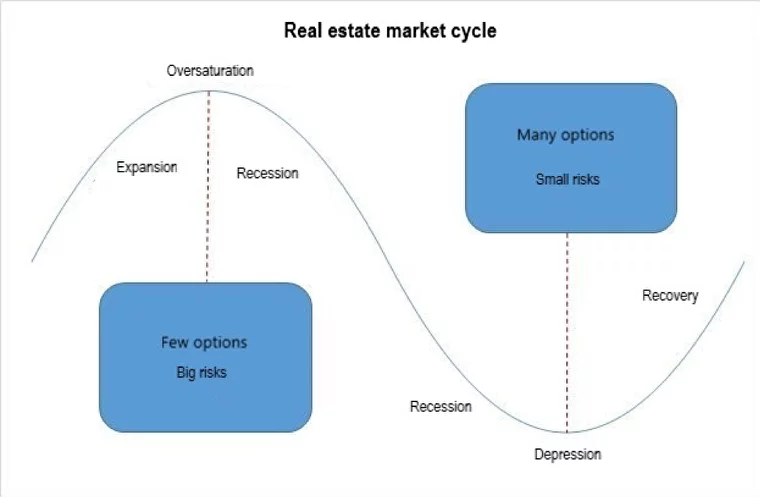
The cycle is divided into 4 stages:
• expansion;
• oversaturation;
• recession;
• recovery.
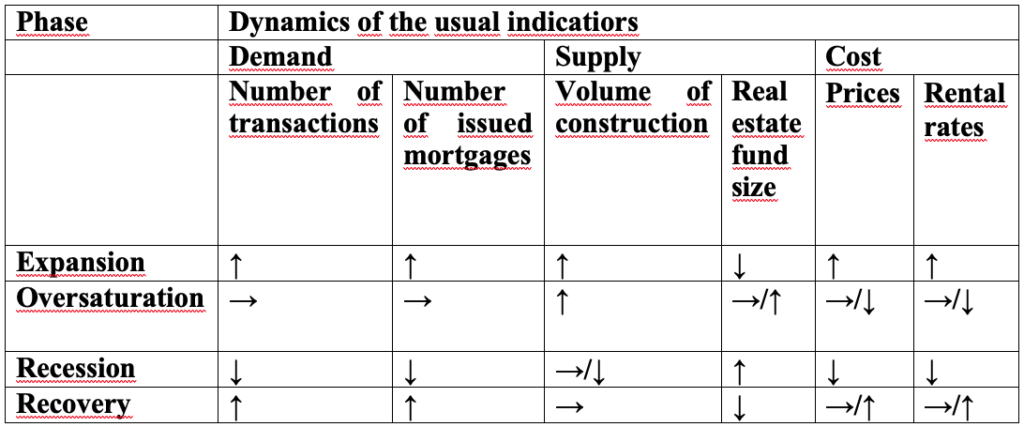
Each stage is characterized by its own shift in prices, volume of construction and the number of transactions. Therefore, in order to conduct profitable transactions with real estate (purchase / sale), you need to understand in which phase the real estate market is at the moment.
Expansion
The purchasing power of the population and the rapid growth of the economy lead to the emergence of expansion. This phase is characterized by a sharp decline in the number of real estate, while the interest of buyers, on the contrary, is significantly increasing. Increased demand results in an increase in the amount of issued mortgage loans and, accordingly, an increase in the number of transactions. To meet the rapidly growing demand, investors are starting to invest in construction. As long as there is a shortage of real estate on the market, its value will rise and rental rates will rise.
Oversaturation
Investors think that their costs will be paid off due to the growth of rental rates and real estate prices, and stop focusing on the constantly increasing value of real estate and land. This is also beneficial for property owners. At some point, prices begin to exceed the financial capabilities of the population, and therefore the number of transactions decreases. However, it is impossible to quickly stop the construction started during the first stage. As a result, the real estate market is oversaturated, which leads to the formation of the so-called “bubble”.
A real estate bubble is a type of economic bubble. It often occurs immediately after the land boom (the rise in prices to the maximum possible value and their subsequent decline).
Recession
This stage is characterized by a decrease in the size of rental rates and prices in connection with the reduced demand, and an increase in the number of unwanted real estate (construction projects started at the first stage are being completed). At this time, those who invested money in the construction of new facilities begin to “freeze” projects, because of this the volume and pace of construction slows down.
Recovery
The decline in property prices will not stop until the value comes in line with the capabilities and needs of buyers. Gradually, the number of transactions begins to increase again, respectively, the number of unwanted real estate is becoming smaller and smaller. Ideally, the overall economy is also growing during this phase, which helps to sustain demand for real estate and housing.
Development of price cyclicality in the Czech Republic
According to the data of the Czech Statistical Office, since 2000 the prices for old apartments have tripled. The prices for land plots and family houses have risen not as much, but still significantly. Despite the fact that real estate prices are now the highest in the history of the country, they are still lower than in other EU countries.
According to the director of the Department of Price Statistics Jiři Mrzek, the cost of plots, apartments, houses in other European Union countries is growing as rapidly as in the Czech Republic. The Czech Republic is now in sixth place (22.2%) in terms of growth in real estate prices in 2016. The specialist connects this trend with the economic growth that we have observed and low interest rates on mortgage loans.
In the first quarter of 2017, property prices in the Czech Republic increased by 12.8% (year by year), which is the highest among the EU countries. On average, prices in the Union countries rose by 4.5%. This is evidenced by data from Eurostat.
According to the Czech Statistical Office, the average prices of apartments in the Czech Republic in 2018 increased by 8.5%.
In the first quarter of 2019, prices grew much more slowly, by 3.5%.
Prague, compared to other regions, remains the most expensive in terms of property prices. From the year 2000 to 2015 the cost of houses in Prague increased by 65%, and for apartments by 135%. But the most dramatic jump was recorded in the Moravian-Silesian Region and Hradec Králové. In Usti nad Labem, apartment prices have increased by 52% and are the lowest. And in Vysočina, you can buy the cheapest family houses, despite the fact that their prices increased by 58%.
The cyclical nature of prices in the Czech real estate market — in numbers
1. 2000-2003 – expansion (growth 70%).
During this period, the Czech Republic developed rapidly until its accession to the EU in 2004. This also led to an increase in demand.
2. 2003-2005 – recession (-10%).
3. 2005-2007 – recovery.
4. 2007-2008 – expansion (+120%).
5. 2009-2013 – recession (-60%).
This period began with the US mortgage crisis, bank failures and falling stock prices, which led to an economic crisis around the world.
6. 2013-2014 – recovery (+ 15%).
7. 2014 to the present day – expansion, which is characterized by recovery and economic prosperity.

Conclusion
To understand at what stage the real estate market is at a given moment in time, it is necessary to study and analyze indicators such as supply and demand, or rather the dynamics of their fluctuations in the long term. We should never forget to include real estate prices in this analysis as they are the main indicator of the market.
Demand is expressed in the number of loans issued (mortgages) and the number of transactions carried out. Sometimes indirect data is also taken into account – the volume of money transfers for the purchase of real estate, the number of registered purchase and sale transactions.
The ratio of real estate value and income determines the purchasing power of the population.
The offer is expressed in the number of started or completed construction projects, as well as in the total volume of housing stock. Prices for objects are indicated for 1 m² or the rate for rent.

